Cloud Elements | Campaign
Cloud Elements: State of API Integration Campaign
Overview
Using data to make decisions is more important now than ever.
In our fourth annual State of API Integration report, we collected responses from 380+ API enthusiasts across 28 industries to determine where API integration is trending in 2020.
When you download the report, you’ll also get access to slides and a recording of our 2020 State of API Integration virtual event, featuring the industry experts who contributed to the report.
Approach
Landing Page
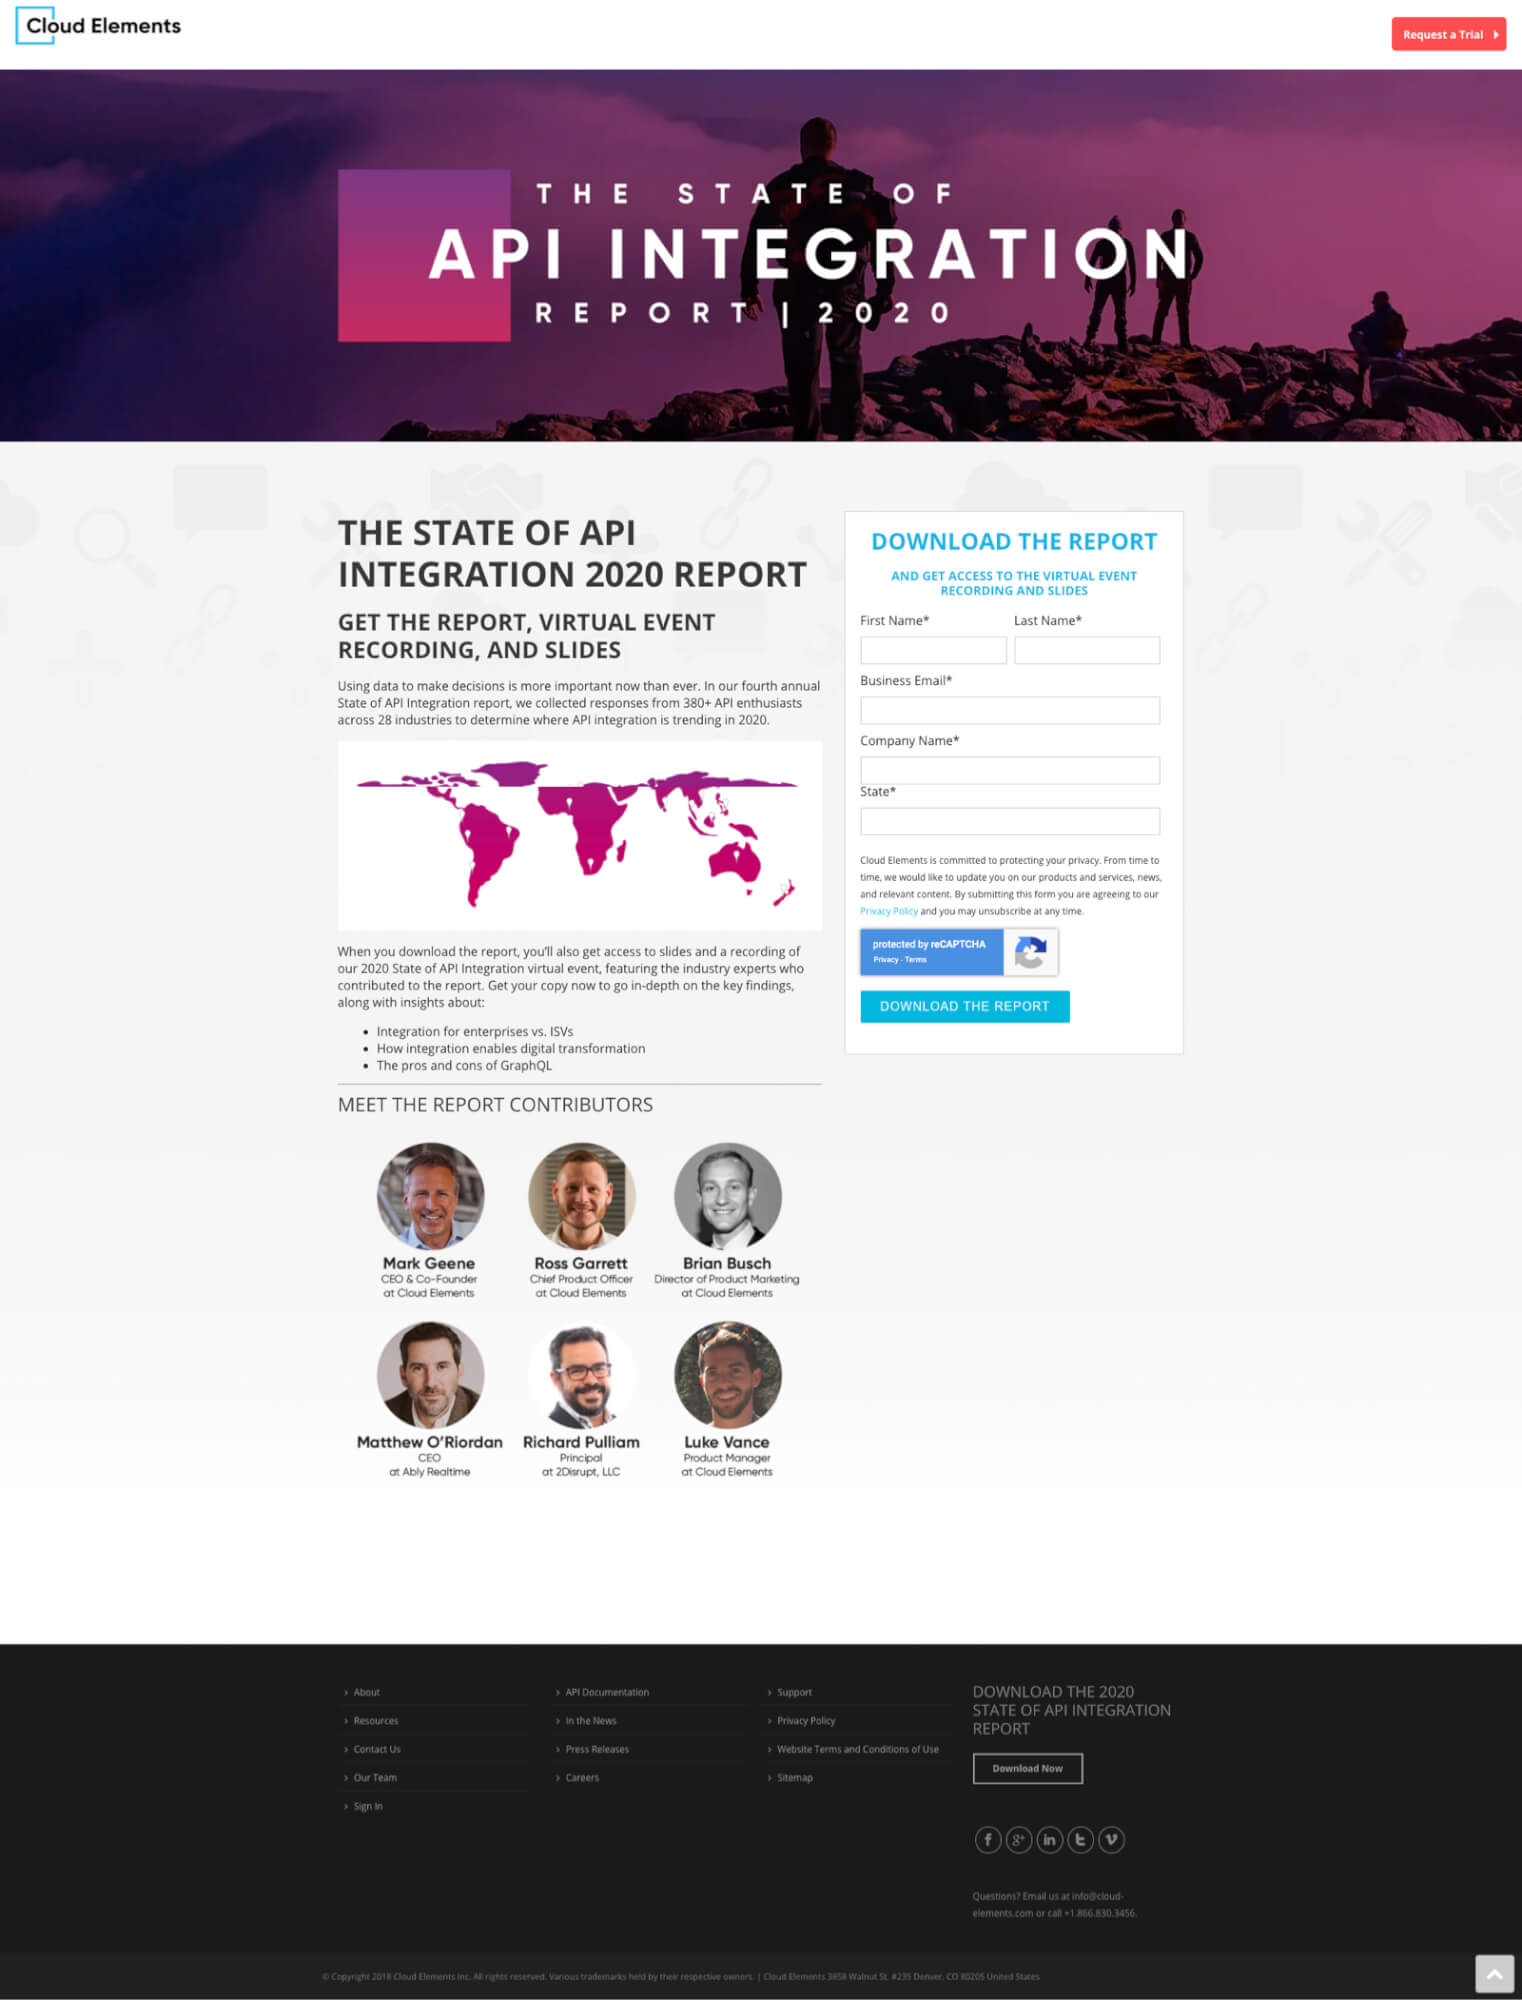
Two landing pages were created: one for the live webinar on launch day and one for post-launch so visitors could download the report and webinar recording. Both pages provided the benefits of downloading the report and attending the webinar, including some stats and visuals from the report itself. SmartAcre® also included who were the main contributors of the report to that Cloud Elements wasn’t the only team behind the report, thus increasing its legitimacy.
Emails
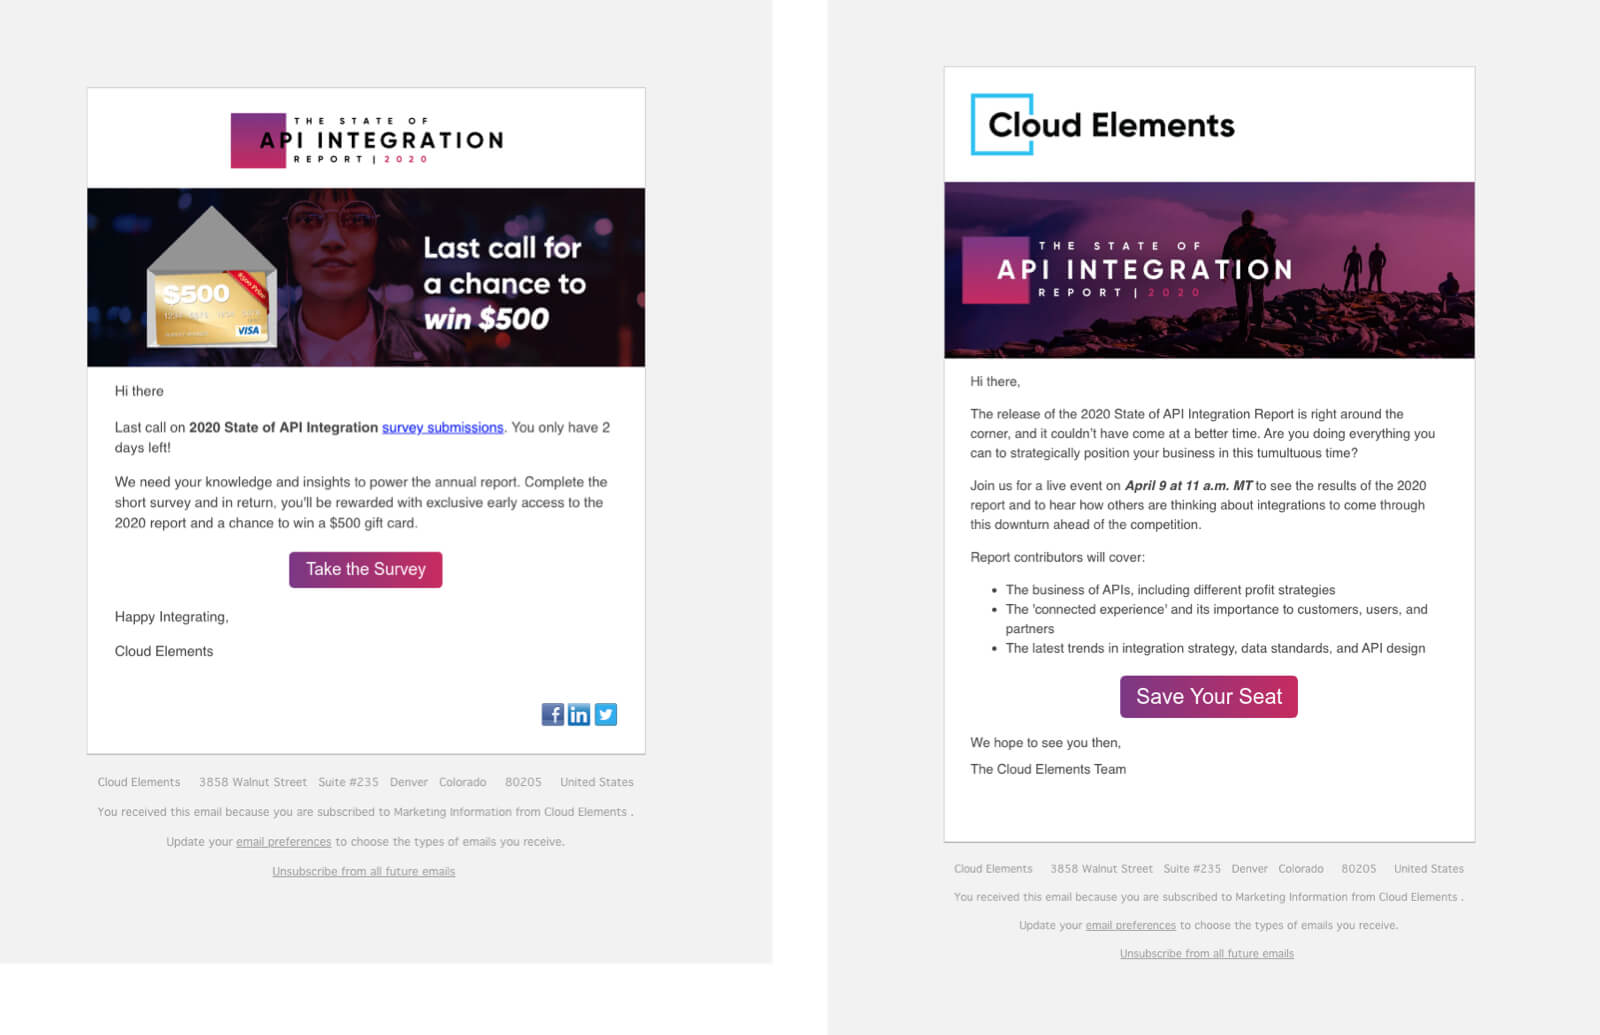
Email was used as a main tactic to get in front of the client’s large database. First, emails were used to attract survey submitters by offering the chance to win $500. This email included an animated gif banner, which had proven to increase the chance of someone interacting with the email in previous years. Emails were also used to entice the client’s database to sign up for the live webinar and then to download the published report.
Logos
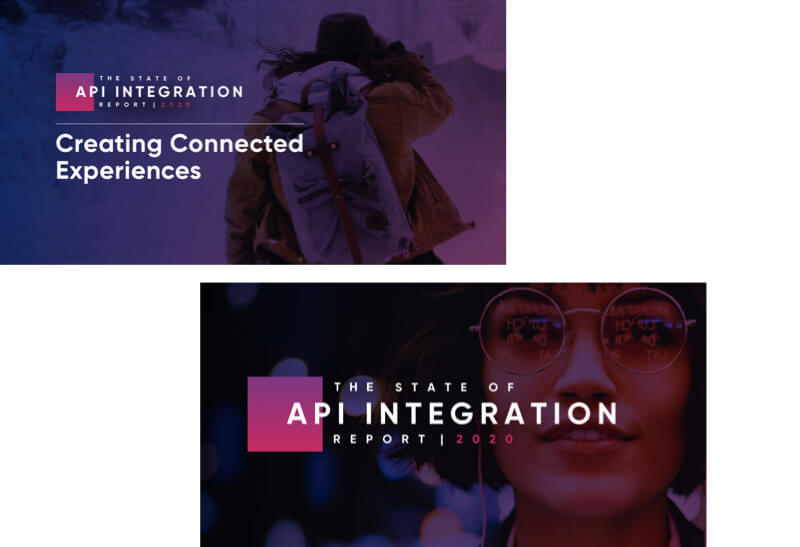
In previous years, the State of API Integration report’s branding did not follow Cloud Element’s branding 1-to-1. This year, SmartAcre recommended bringing both brands together to solidify Cloud Elements as the creator of the report. The logo brought in color and shape elements from the client’s recent rebrand, while still focusing on the report.
The Report
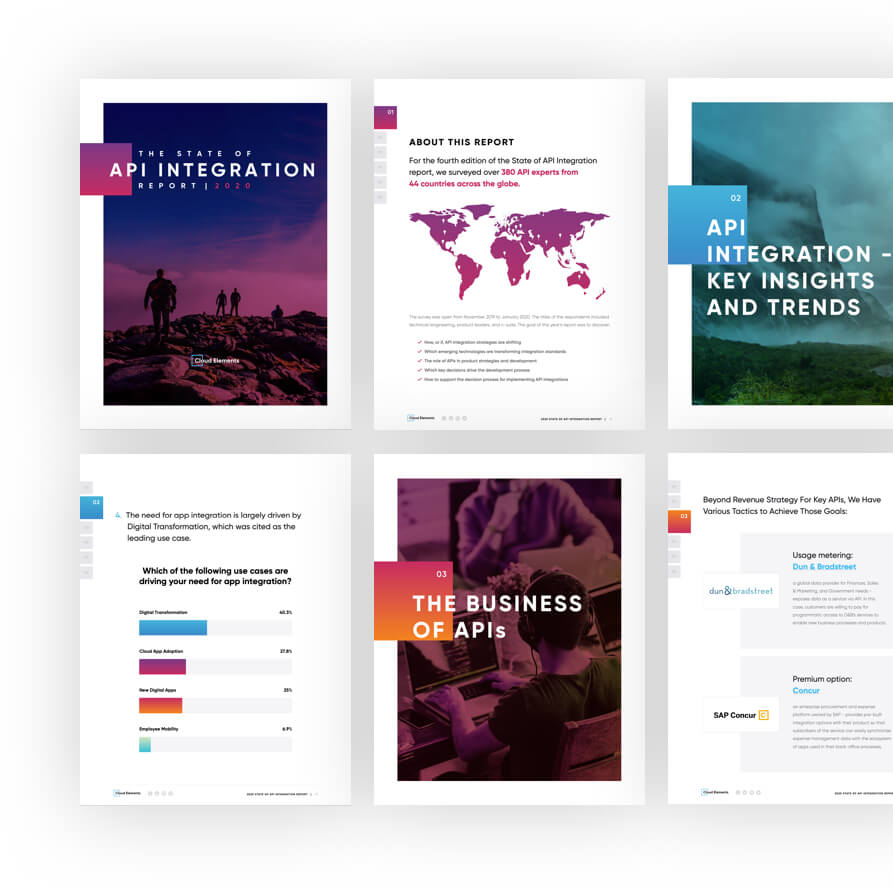
SmartAcre templatized the report to provide a visual for the client as a reference. Again, the goal was to tie in the client’s new branding to make the connection between Cloud Elements and the State of API Integration report synonymous. Once the content was finalized, the SmartAcre team began to lay it out within the template of the report, as well as started to design callouts, graphs, and graphics to make the report more engaging.
Remarketing Ads
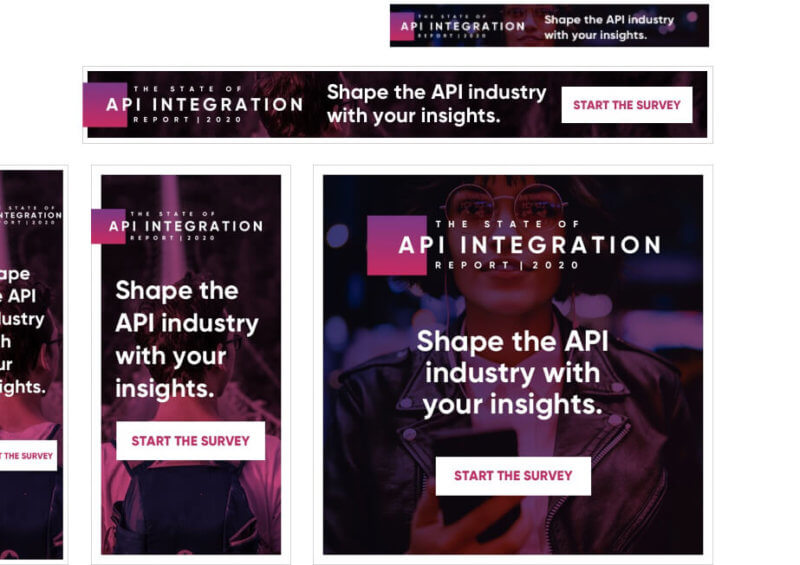
Remarketing ads were initially used to target previous report downloaders and contributors to persuade them to take the 2020 report survey, which is the backbone of the report. This tactic was also utilized to retarget anyone who did not download the 2020 report once it was published.
Webinar Graphics
Every year, the client would host a live webinar that featured the report contributors discussing the findings of the new report as well as answering any questions from the participants. Graphics were required to improve the webinar experience (from sign-up to attendance).
Social Graphics
Social was another key tactic in promoting the survey, webinar, and report. Numerous social graphics were designed to match a similar style to the report and were used on all major platforms including Facebook, LinkedIn, and Twitter.
Outcomes
$47K
In attributed revenue
1.3K
Web leads generated
660
New contacts generated
Related Case Studies
Pillar Page Strategy for Demand Gen Contributes Organic Pipeline in 90 days
SmartAcre recognized the opportunity for WorkStep to own and rank for industry-specific keywords related to Frontline Employee Engagement and provided a pillar content strategy, development, and promotional...
Annual Content Strategy to Increase Organic Demand Generation
SmartAcre worked to create a demand generation based content strategy for a leading employee engagement solution provider to drive organic rankings and produce organic-first pipeline.
Marketing Automation Implementation Helps Global Leader in Hospital Generic Improve Their Sales Process and User Experience
SmartAcre worked with Piramal Critical Care to digitize the sales conversation and improve the sales process.
Where We Start
Book a strategy session and we will discuss your unique challenges. For free. Maybe one day you will have a success story to add to this page.

