
What’s The Deal with Data Studio?

Summarize this insights post with:
What’s been your main struggle in the ever-evolving digital space over the past few years? Has it been managing the constant barrage of new digital advertising platforms? Integrating Salesforce into your reporting structure? Managing new contacts in Hubspot? We have all trudged through the overwhelming amount of platforms and managed success, but have you done it using one intuitive and breathing reporting dashboard?
Instead of manually exporting loads of data and spreadsheets into custom reports that require lots of hand-holding and explanation, there’s a better way. In 2016, Google launched a new tool to surface your data and present informational, easy-to-understand reports through visualization. Today, we will explore the capabilities of Google Data Studio and provide some of the tips and tricks we’ve formulated to help you take full advantage of this intuitive reporting platform.
The end result? Reports that are understandable, shareable, and customizable for each of your clients. You can select how you want to present the data, and set custom branding to match the look and feel of your organization, right down to your logo. Dates can be adjusted on the fly to drill into a certain time range, like when you launched a new campaign, or more broadly, to uncover trends quarterly or annually.
Here is a list of Google Data Studio’s full capabilities:
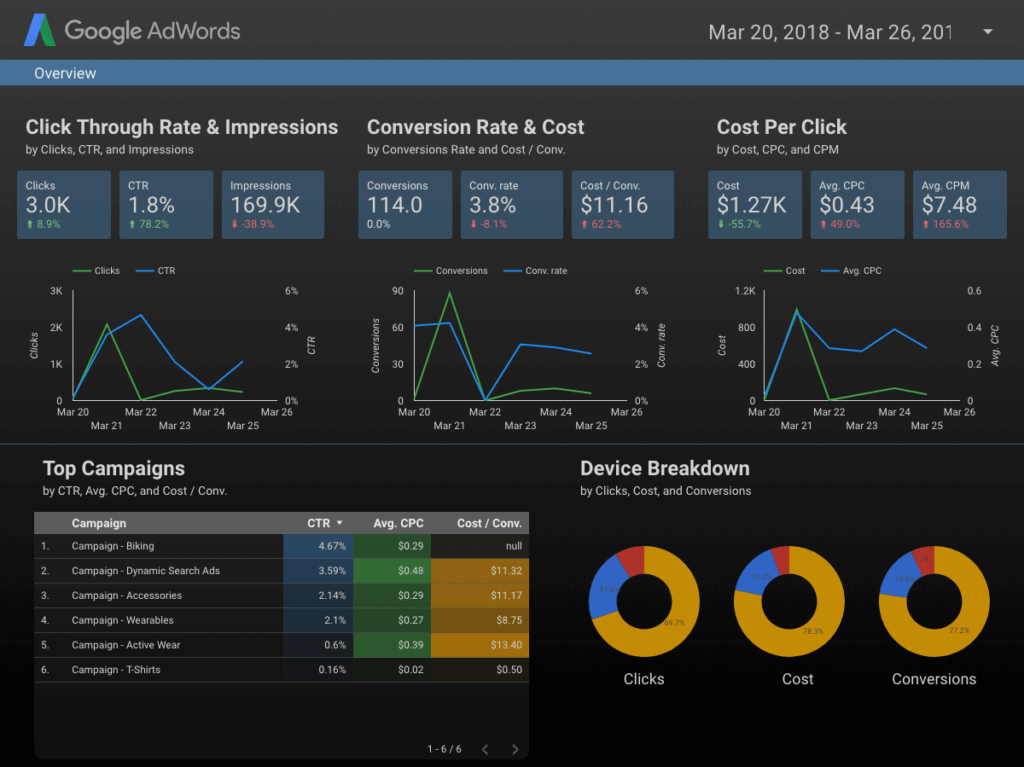
- A visual editor for easy creation of reports and dashboards.
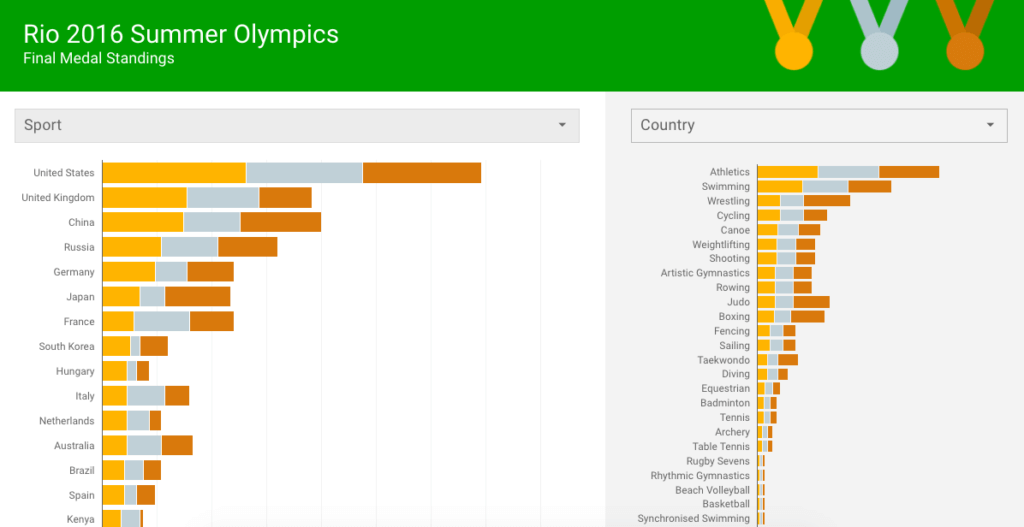
- A rich library of visualizations to reveal the real story behind the data.
- Fully custom design and style control so you can make it your own.
- Reusable templates for fast, professional reports every time.
- Dynamic and interactive report controls based on time periods, geographies, segments, or any other dimension available in your data.
- Seamless integration between data, analysis, and reporting for easy workflows.
Originally, the capabilities of Data Studio were limited to other Google entities: Google Analytics, AdWords, or Search Console. From late 2016 to September 2017, users could only integrate data directly from these three platforms until Google introduced Community Connectors. Previously, if you wanted to import data from Salesforce or Facebook, you needed to use a Google Sheet or a CSV file, a process that was largely ineffective and didn’t breathe like the rest of the report, resulting in “broken” reports. Fortunately, Google introduced the concept of Community Connectors in late 2017 – these easy to build connectors are created using Google Apps Scripts. Once created, a connector can be shared with other users, who can then use the connector to access their own data.
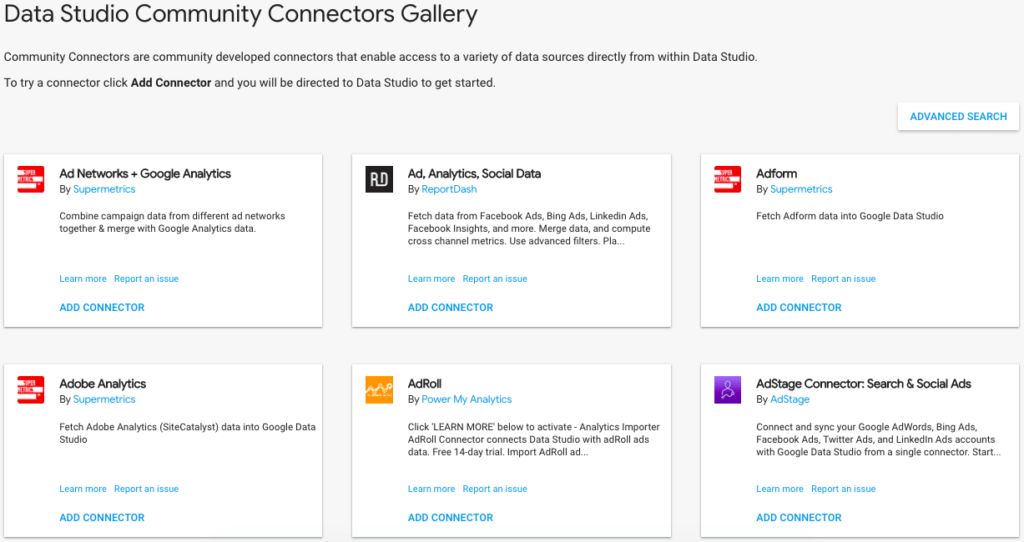
Community Connectors present the opportunity for developers around the world to promote their brand and integrate data from a multitude of different platforms, including:
- Salesforce
- Amazon
As Google Data Studio grows and transforms, the connector space will evolve with it, and more trusted brands will delve into this space. If your team is up for it, you can even build a connector of your own!
Now that we have a grasp on what Google Data Studio can and cannot do, and we understand which platforms we should integrate, let’s consider templates. Once you have all of your data and you know what your clients want to see, you need to ensure your report is both understandable and visually pleasing. As with connectors, your team can develop their own template or utilize a catalog of reporting templates that companies and individuals have already developed (check out this list from Oribi highlighting some great templates). Whether you’re tracking leads from Salesforce or outlining your billing from the past few months, Data Studio hosts a plethora of report templates that can connect to your own data sources.
Now that we’ve covered the data-side of your reports and the visual aspect, you’re probably ready to dive in. some tips and tricks to make sure your report is set up for success:
- Start with a dummy template and understand the inner workings of the platform
- Start small – use Google’s “trusted” data sources (AdWords, Search Console, Analytics) then build out your report with other community connectors
- When deciding on a Community Connector, research the company responsible for the connector to ensure you trust them with your data
- Explore different report sizes – if you want to display your report on a screen, use canvas, or create a custom size to fit your needs
- Collaborate – bring in different team members and gather their opinions on design and data
Google Data Studio presents a solution to an issue that so many marketers experience: too much data with no proper visualization. With Data Studio, you can choose how much data you want to see. This makes it easier to properly explain your data to clients, internal team members, and/or external stakeholders. Are you overwhelmed at the thought of diving into this new platform? SmartAcre® has a team of Google Data Studio experts ready to lend a helping hand.
Contact us today to get your reporting into high gear.